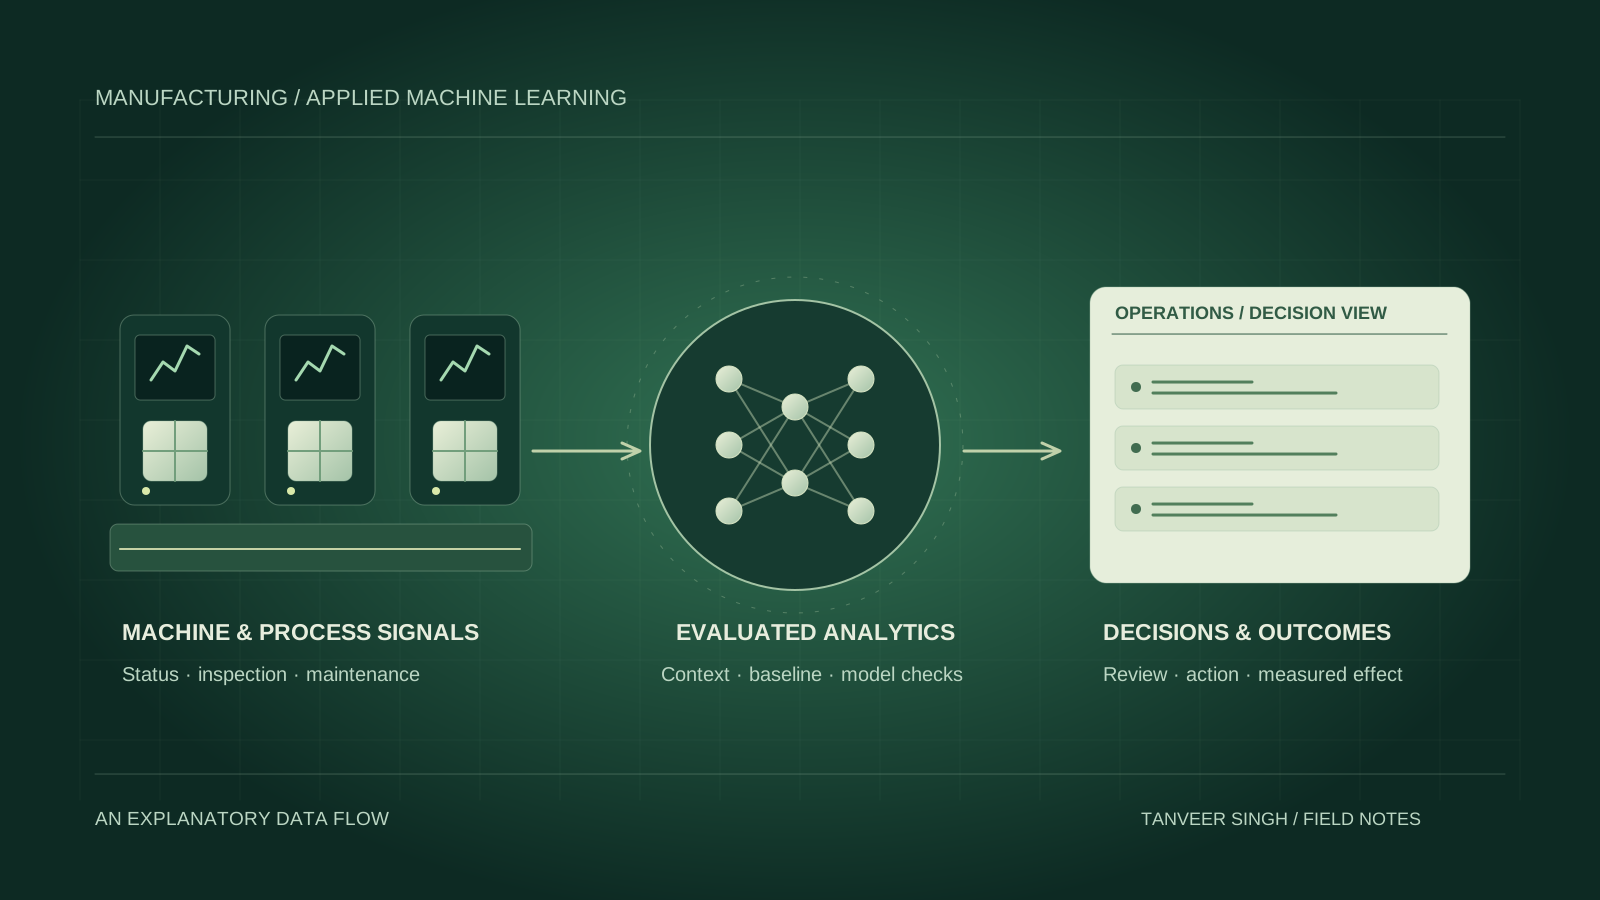
A factory does not become more profitable because a screen says AI. It becomes more profitable when fewer usable hours are lost, fewer parts are rejected or the same good output needs less material and energy. Machine learning can support those improvements, but only when there is reliable data and a practical response to the information.
Start with the loss, then decide whether ML helps
Imagine a machining line that occasionally produces a batch of rejected parts. Temperature, vibration, tool changes and inspection results all exist somewhere, but no one can see them together. A useful first step is to connect those records. A later model might identify conditions associated with poor quality early enough for someone to investigate. The business value comes from the investigation and avoided loss, not the prediction alone.
This guide explains where machine learning in manufacturing can be useful, the live metrics worth tracking and how to test a financial case. The examples and amounts are fictional planning illustrations, not measured results from a client factory.
Monitoring, prediction and action are different jobs
Monitoring tells you what is happening: a machine is running, a shift has produced a certain number of good parts or a feed has stopped updating. Much of this can be built without ML. If a reliable temperature threshold already identifies a problem, it is a sensible baseline to keep.
A model adds an inference. Anomaly detection asks whether behaviour looks unusual compared with relevant history. Predictive maintenance estimates a condition or risk from signals and past outcomes. Quality prediction looks for relationships between process conditions and rejected work. These are different questions with different data requirements.
The third job is action. Someone needs to inspect the machine, plan maintenance, review a process setting or investigate a batch. NIST’s manufacturing monitoring research connects sensing and analytics with verified decision support for downtime and production quality. A dashboard becomes useful when it supports that kind of decision.
Where ML can create a useful business result
Predictive maintenance can help a team investigate signs of deterioration before a disruptive failure. It needs a relationship between measured condition and real maintenance or failure outcomes. With limited failure history, an honest pilot may offer condition monitoring rather than a confident prediction of exactly when a machine will stop.
Quality monitoring can connect process signals, inspection records or camera images with defects. Consistent product identifiers and inspection labels matter. A change in lighting or product mix can change a vision model’s behaviour, so a good demo on one batch is not sufficient evidence for production use.
Energy analysis can show whether consumption per good unit changes with machine condition, product type or idle time. Forecasting can support production and stock decisions when demand records are consistent. Each use case needs its own business baseline; adding several models at once makes it harder to know what improved.
The real-time metrics a factory dashboard should explain
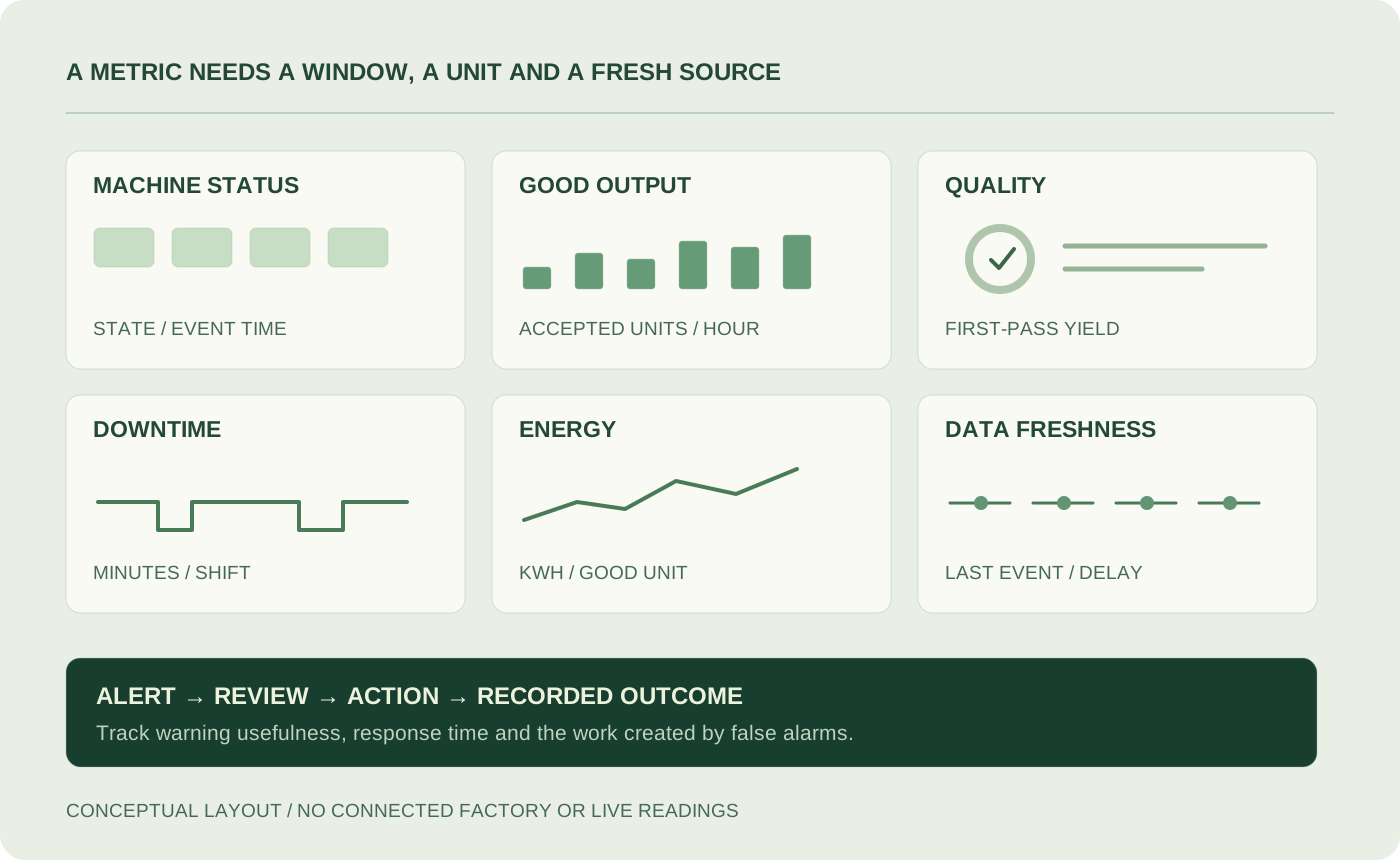
A metric is useful when its definition is clear enough for the production manager and the software engineer to get the same answer. Give every measure a unit, source, reporting window and last-updated time. Keep the underlying counts visible so someone can investigate an unexpected result.
OEE, or overall equipment effectiveness, combines availability, performance and quality. AWS IoT SiteWise documents this calculation from equipment-state and good/bad production streams. Definitions still need to match the process: use consistent scheduled time, product-specific cycle standards and the same calculation window. OEE is an operational indicator, not a direct measurement of profit.
- Machine status: running, idle, stopped or unknown. Show the source event time; do not treat an expired reading as current.
- Good output: accepted units per hour and accepted units this shift. Compare like-for-like products and planned operating time.
- Unplanned downtime: minutes lost within the agreed scheduled window, with reason codes and affected machine or line.
- First-pass yield: units accepted without rework divided by units entering the process. Track it separately from final yield after rework.
- Scrap rate: rejected units divided by total produced units for the same batch or window. Show both counts and the percentage.
- Energy per good unit: measured kWh divided by accepted output from the matching meter boundary and time window.
- OEE: availability × performance × quality, using factors as fractions. Document planned-stop treatment and the ideal rate for each product.
- Alert outcomes: alerts reviewed, confirmed issues, missed issues discovered later and time from warning to useful action.
- Data health: missing events, oldest pending event, last successful update and the share of feeds that are stale.
What real-time means in an actual factory
Real-time needs a definition tied to a decision. A production supervisor may need a one-minute summary, while a machine-condition use case might need measurements at a much higher frequency. The collection rate, model evaluation interval and screen refresh rate are separate choices. A screen that refreshes every second cannot make yesterday’s spreadsheet live.
A practical data path connects approved machine or gateway feeds to validation, storage, calculations and a dashboard. Machine identifiers, units, product context and timestamps travel with the readings. Track the event time at the source and when the system receives and processes it, so delayed messages can be recognised.
Late or duplicate events need defined handling. Shift totals may need reconciliation when a gateway reconnects. If a feed goes offline, show unknown or stale status and explain which summaries are incomplete. Seconds-level refresh can be a target in a scoped project, but it is not a blanket promise for every factory or network.
Calculate the margin opportunity without inventing savings
Start with a baseline: what is lost now, how is that loss recorded and what would realistically change? Downtime has financial value only in its business context. Recovering eight hours on a bottleneck with waiting orders is different from creating extra capacity when there is no demand.
For scrap, use the avoidable cost of rejected work rather than automatically using the full selling price. For energy, use measured consumption and the relevant tariff. Separate a live estimate on the dashboard from benefits confirmed after production and finance records have been reconciled.
In a fictional planning example, suppose a pilot could avoid eight hours of bottleneck downtime at ₹6,000 contribution per hour, saving ₹48,000 per month. A separate reduction of 120 rejected parts at ₹150 avoidable cost adds ₹18,000. Avoiding 2,000 kWh at ₹6 per kWh adds ₹12,000. If those categories do not overlap, the estimated gross monthly benefit is ₹78,000.
If operating, review and maintenance costs total ₹30,000 per month, estimated net monthly benefit is ₹48,000. With a fictional all-in setup cost of ₹3,60,000, simple payback is 7.5 months: setup cost divided by net monthly benefit. These amounts are not a quote, a forecast or evidence of what your factory will achieve.
Do not count the same improved output once as recovered downtime and again as avoided scrap. Check whether additional demand exists, whether another process becomes the bottleneck and whether support or inspection costs grow. Simple payback also leaves out financing and time value; it is a first screening calculation, not a complete investment decision.
Judge a model by useful warnings and actual outcomes
Accuracy alone can be misleading when failures are rare. A model that usually reports normal may look impressive while missing the events that matter. NIST’s industrial AI guidance highlights the importance of false alarms, representative evaluation data and the operational consequences of a detection system.
For a maintenance pilot, record how many warnings led to a confirmed issue, how many known issues were missed, how early useful warnings arrived and how much investigation time they created. A technically correct warning that arrives after a breakdown offers little preventive value.
Use later time periods for evaluation so future information does not leak into training. Compare similar products, shifts and machine conditions. Start in observation mode alongside the existing process, review false alarms with the team and document the model version behind each prediction. The model needs monitoring after launch as equipment and operating conditions change.
A focused pilot is easier to trust and maintain
Begin with one line or machine family and one outcome. Review the available history, identify missing records and agree a metric dictionary. Then build the monitoring baseline and decide whether ML adds value. Keep a record of what the system cannot yet infer.
Run the pilot long enough to observe representative operating conditions; a single good day is not a business case. Agree success criteria, review points and the conditions for stopping or changing direction before expanding the rollout. A useful result can be that better monitoring is sufficient and no model is needed.
Use approved, controlled connections to industrial data sources. Start with monitoring and advisory workflows, with your operations and automation team involved. Access rules, retention, backups and recovery belong in the delivery plan. Machine-control changes require separate engineering and operational approval.
Questions to answer before building
You do not need a finished technical specification to start. Bring an example of the process you want to improve, the records you already have and the decision you want someone to make sooner. That is enough to begin a realistic conversation about a pilot.
- Which loss matters most, and how do you measure it today?
- Can records be linked by machine, product, batch and time?
- How quickly must the information arrive for someone to act?
- Who reviews an alert, and how will its outcome be recorded?
- What does a missed issue cost compared with an unnecessary investigation?
- What recurring hardware, hosting, monitoring and support costs are acceptable?